By The Numbers
To be clear eyed and optimistic, start with the “clear eyed” part.

In Carbonville, everyone is a polluter.
Everyone’s activities contribute to greenhouse gas emissions. Eating, traveling, building, dwelling. All nations contribute to emissions. Making wind turbines does, too. It’s why The Work has three components: reducing, removing, and making clean products.
Some corners of Carbonville show significant progress – we should celebrate that (e.g., solar PV, the subject of my next post). Technology improves, as does awareness, as does policy. We have options today we lacked 10 years ago, or even one year ago.
Humans are narrative animals. Stories help organize our world and worldview. But facts and math, not stories, must be the stars by which we navigate.
In that spirit, it’s helpful to take a moment and assess where we’re at as a nation and as a globe. The Rhodium Group and the IEA have been long-standing bulwarks of data and analysis, and they help us assess where we’re at.
American atmosphere gains weight
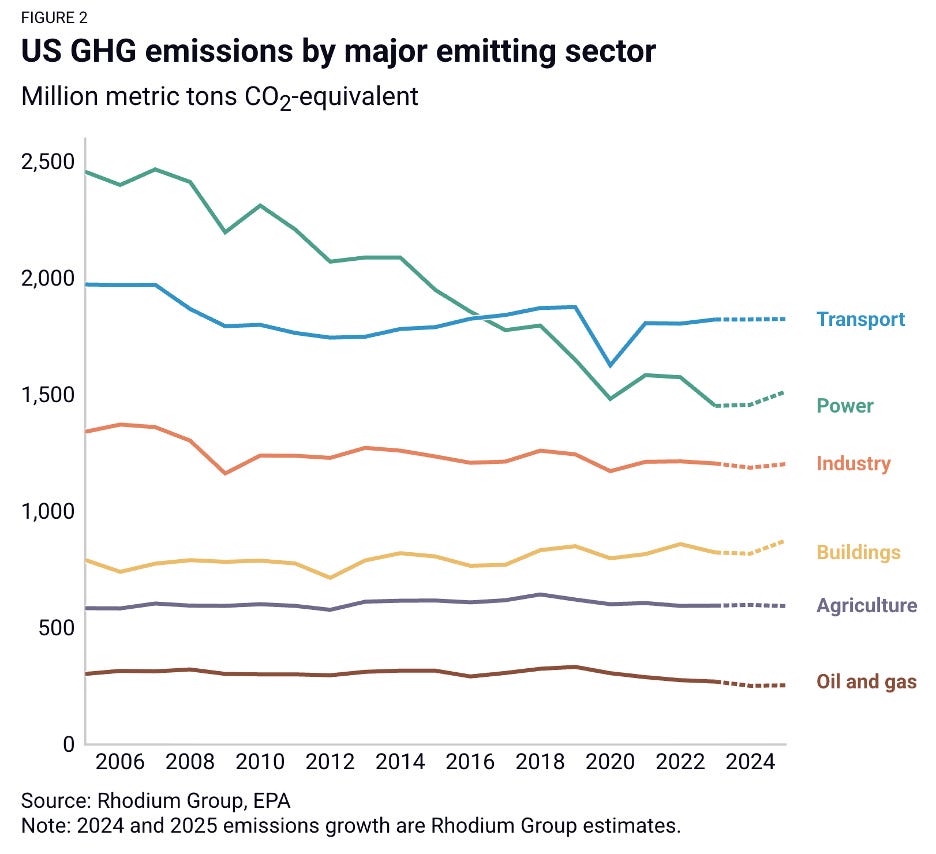
Every year, the Rhodium Group does a preliminary estimate of greenhouse gas emissions for the U.S. These numbers and facts have accurately represented where we’re at for over a decade. The 2025 numbers maintain that quality and carry sobering implications.
The whole report is worth a read for the dedicated soul.
The punchline: emissions went up.
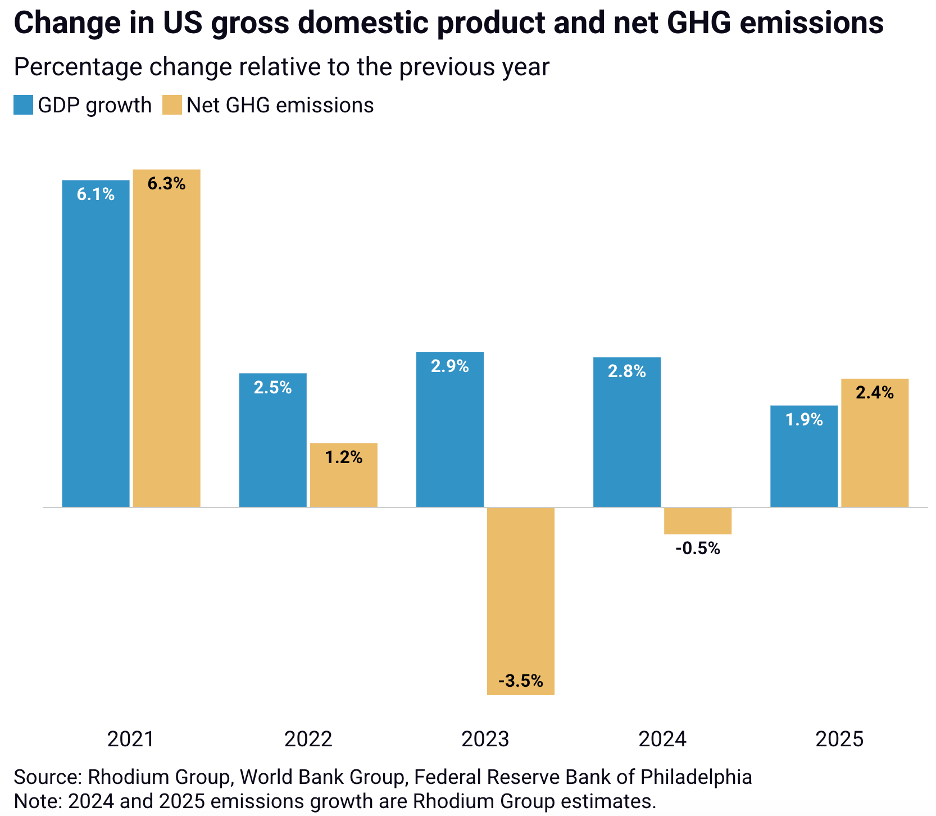
And emissions grew more quickly than GDP in 2025. Take that decoupling!
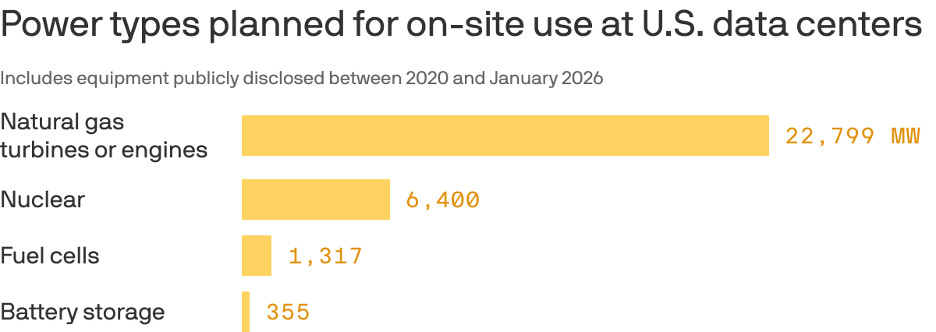
In part, this was due to 2025 cold snaps, which led to increased power draws. In part, this is because natural gas demand grew (in part due to data center growth – see below). That drove prices higher, which led to more coal use and more emissions. Yes – the US burned more coal this year.
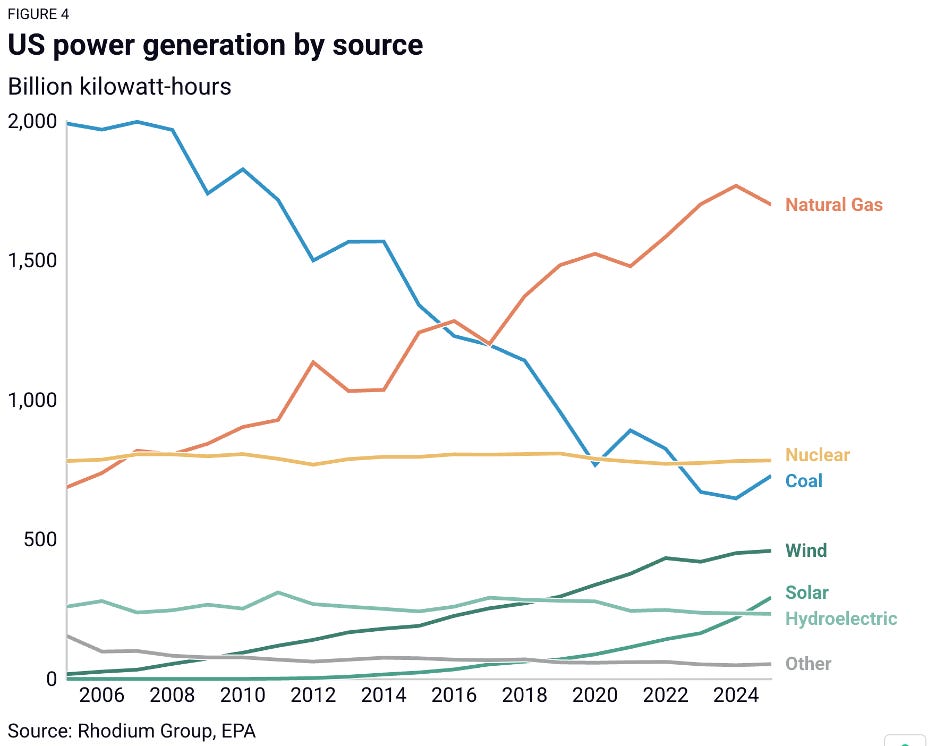
It’s worth noting that the solid, regular growth in wind and solar (in part enabled by lower costs and lower battery costs) did not reduce fossil demand. This led to increased power sector and building emissions in 2025. Everything else remained pretty flat.
The observed emissions increase is not due to politics alone and cannot be reserved by changing leadership alone. The Work will involve infrastructure upgrades, permitting reform, innovation, community engagement and acceptance, and lots of taxpayer, rate payer, and shareholder money.
Coal goes up
Coal is roughly 40% of global CO2 emissions. The world cannot stabilize or reverse climate without ending coal use, coal emissions, or both. I’ve written before about the challenges of decoalification (here, here, and here). Alas, 2025 was a masterclass in those challenges.
Total coal use in 2024: 8.77 Gt
Total coal use in 2025: 8.85 Gt.
Source: UN Environmental Program, 2025.
Unsurprisingly, much of this is China. Chinese coal use in 2025 was 4.83 Gt, up 1.2% from 2024 and over 40% of global coal use. Yes, coal-fired power generation decreased slightly (for the first time ever!) but industrial use increased, so emissions increased. Moreover, China commissioned 78 GW of coal projects in 2025, while proposed coal projects (new and reactivated plants) reached 161 GW.

It’s true that 2025 showed astonishing growth in Chinese renewable power, most notably solar (again – will discuss in next post). Equally astonishing is the growth in China’s EV fleet and manufacturing capability, bringing battery-powered vehicles of all kinds around the region and the globe.
That doesn’t change the coal numbers. At all.

China was not alone. Many developing economies increased coal use – for cement, aluminum, and power. Indian coal use was immense. India alone consumes more coal than North America and Europe combined, and while it decreased coal in the power sector (in large part due to renewables) India significantly increased coal demand for non-power uses. Same in Southeast Asia, led by Indonesia.
Of course, coal demand will plateau – and possibly soon. That’s grounds for optimism. To be clear eyed, however, demand will be strong for years around the world, and the atmospheric signature of coal will grow. More action is required.
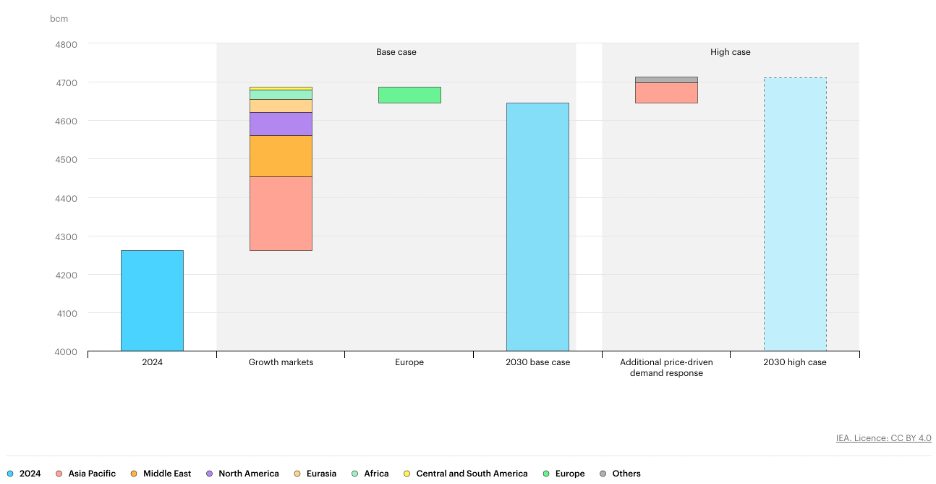
Gas goes up – a lot, and everywhere
Renewables are growing fast. So is gas – in North America, in Asia, in the Middle East.
Certainly, gas growth in North America is profound and rapid. This is again a demand story – for electricity above all, driven in large part by data centers.
That’s not the whole story. Demand grew significantly in the Middle East and Asia, and is projected to grow for the next 5 years.
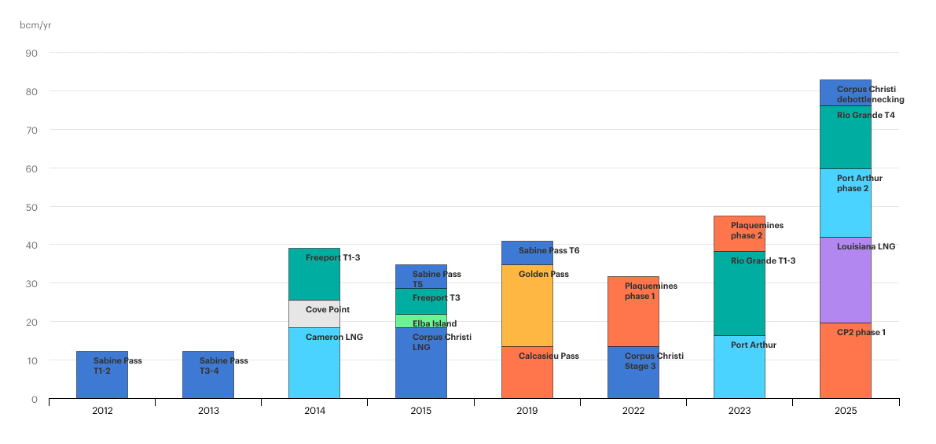
Demand growth drove increase approval of LNG exports terminals. In the U.S. case, it’s worth noting that export terminal approval is independent of politics. While the current Trump administration has accelerated approvals, many happened during Obama, Trump 1, and Biden, and each administration saw growth in final investment decisions (FID).
There has been notable progress in routine flaring, in methane monitoring, and in reductions in fugitive methane. That’s great.
That doesn’t change the global gas numbers. At all.
Clear-eyed and optimistic
It’s easy to spin a sunny narrative around the good news. It’s also easy to spin a gloomy narrative around the bad news. Either way, one must start with the numbers themselves to understand where we are and where we need to go.
Progress is progress.
The numbers are the numbers.
The world will not significantly change the numbers through local bans or performative acts. Decisions around energy and climate are driven by geopolitics, economics, trade, industry, investment, and tax base as well as climate. Change will require more innovation, more diplomacy, more cooperation, and more focus on reductions, removals, and clean production.
I find reviewing facts like this clarifying. It confronts me with how much needs to be done in so many places. It inspires me to commit to more action, more innovation, and more humility. It directs me where to focus my attention – on the hard stuff as well as the seductive or straightforward stuff. Finally, it reminds me that the job is global and intergenerational, requiring as much cooperation as ambition.
In the end: The Work is The Work.
---
These numbers are produced by legions of analysis and workers. Any given analysis may be off a bit, in time, magnitude, or sense. But the numbers are the numbers – inviolate and enduring. I salute those workers and analysts one and all.

I also want to acknowledge four people in particular, paragons of clear-eyed optimism.
Trevor Hauser and John Larsen, Rhodium Group, built their business on rock solid data. They don’t bring narrative, they bring facts. I draw inspiration from their excellence. Bless you both.
Tim Gould, Chief Economist of the IEA, and Lazslo Varro, former Chief Economist of the IEA (now at Shell), have earned their reputation for data excellence and unvarnished, clear-eyed assessment. They also both have superb wit and are oodles of fun. Bless you both as well.
Your talking about standard power sources Julio. The resonant power supply technology invented by Nikola Tesla is in final development and it will change all of this.